Strava Heatmap Animation
This app is inspired by a Reddit post from a London-based cyclist who mapped all of his bike rides over the course of 5 years and displayed them chronologically in a video. As a passionate runner and avid Strava user, I had the idea of building a web app that lets any Strava user do the same — without needing technical tools like QGIS.
Strava API
Strava provides a public API that integrates seamlessly into any project. Using OAuth2, users authenticate and the app fetches all their activities with the corresponding GPS polylines.
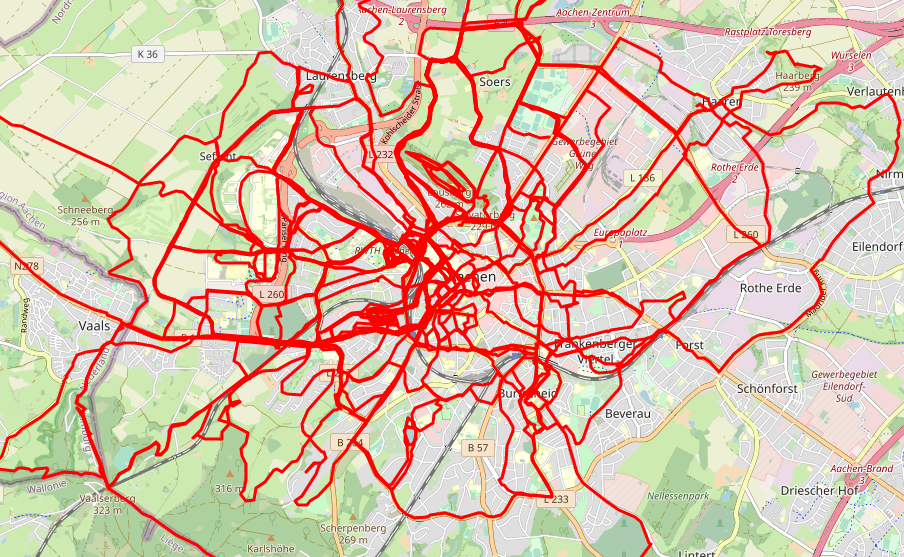
From GIF generator to Leaflet
My first approach was a GIF generator using matplotlib and cartopy. It required a box selection on a map to define lat/lon bounds, then rendered polylines server-side. It technically worked but performance was terrible — 30 seconds for 200+ runs, single-user only, and the server crashed frequently. Switching to Leaflet solved everything. The polylines are drawn sequentially in the browser, performance is near-instant, and the server is only needed for authentication. The map camera follows activities outside the current view automatically, and each activity shows its title, date, and distance.